VPSRVP Sovereign Reign (VPSR) - Advanced Volume Profile Analysis
A sophisticated volume analysis tool that provides deep insights into market participation and momentum through an intuitive visual interface. This indicator helps traders identify significant market moves, potential reversals, and institutional activity.
Key Features:
1. Smart Volume Analysis
• Dynamic volume profiling
• Institutional participation detection
• Abnormal volume identification
• Real-time momentum tracking
2. Advanced Visual System
• Color-coded volume bars
• Adaptive cloud formation
• Reversal pattern detection
• Fake-out warning system
Visual Components:
1. Volume Bars
• Green: Bullish pressure with normal volume
• Purple: Bearish pressure with normal volume
• White: Significant bullish participation
• Pink: Significant bearish participation
• Orange: High-probability reversal zones
2. Dynamic Cloud
• White Cloud: Bullish control zone
• Purple Cloud: Bearish control zone
• Cloud density indicates participation strength
• Adaptive to market conditions
Signal Interpretation:
1. Normal Market Conditions
• Green/Purple bars show directional pressure
• Cloud color indicates dominant force
• Cloud height shows average participation
2. Significant Events
• White/Pink bars signal major moves
• Orange bars highlight potential reversals
• Cloud expansion shows increasing activity
• Cloud contraction indicates consolidation
Customization Options:
• Volume MA Length: Smoothing factor
• Abnormal Volume Threshold: Sensitivity
• Cloud Display: Toggle visualization
• Color scheme optimization
Best Practices:
1. Multiple Timeframe Analysis
• Start with higher timeframes
• Confirm on lower timeframes
• Watch for confluence
2. Volume Analysis
• Compare to historical levels
• Monitor abnormal spikes
• Track participation trends
3. Trade Management
• Use as confirmation tool
• Wait for clear signals
• Monitor fake-out warnings
• Combine with price action
Trading Applications:
1. Trend Analysis
• Identify strong moves
• Spot weakening trends
• Detect consolidation
2. Reversal Detection
• Spot potential turning points
• Identify fake-outs
• Monitor institutional activity
3. Risk Management
• Volume-based position sizing
• Stop loss placement
• Profit target selection
The VP Sovereign Reign indicator excels at:
• Identifying significant market moves
• Detecting institutional participation
• Warning of potential reversals
• Highlighting fake-outs
• Providing clear market context
Risk Warning:
This indicator is designed as a technical analysis tool and should be used as part of a complete trading strategy. Past performance does not guarantee future results. Always employ proper risk management techniques.
Note: For optimal results, use in conjunction with price action analysis and other complementary indicators.
Search in scripts for "VOLUME BAR"

Volume HighlightVolume Highlight
Description:
This script helps users analyze trading volume by:
1. Highlighting the highest volume bars:
• Trading sessions with volume equal to or exceeding the highest value over the last 20 periods are displayed in purple.
• Other sessions are displayed in light gray.
2. Displaying the 20-period SMA (Simple Moving Average):
• A 20-period SMA line of the volume is included to track the general trend of trading volume.
Key Features:
• Color-coded Highlights:
• Quickly identify trading sessions with significant volume spikes.
• 20-Period SMA Line:
• Observe the overall trend of trading volume.
• Intuitive Volume Bars:
• Volume bars are clearly displayed for easy interpretation.
How to Use:
1. Add the script to your chart on TradingView.
2. Look at the color of the volume bars:
• Purple: Sessions with the highest trading volume in the past 20 periods.
• Light gray: Other sessions.
3. Use the 20-period SMA line to analyze volume trends.
Purpose:
• Analyze market momentum through trading volume.
• Support trading decisions by identifying significant volume spikes.
Illustration:
• A chart showing color-coded volume bars and the 20-period SMA line.
Market Core [BigBeluga]MARKET CORE Toolkit
The BigBeluga Market Core Toolkit is a comprehensive suite of advanced trading indicators designed to provide traders with a holistic view of market dynamics, structure, and potential opportunities.
In an ever-evolving market, relying on a single indicator can leave traders vulnerable to gaps in their analysis. The BigBeluga Market Core Toolkit addresses this challenge by integrating a range of complementary indicators that work synergistically to reveal the full picture. From detecting key support and resistance levels to identifying market structure shifts, volume imbalances, inefficiencies or analysis of money flow, this toolkit covers every aspect of market behavior.
⬤ Order Blocks
BigBeluga Order Blocks revolutionize the way traders visualize potential areas of significant market activity. Unlike traditional order block indicators that often result in cluttered, noisy charts, these Order Blocks are designed for clarity and effectiveness. They simulate and predict where large areas of market orders may rest by analyzing volume and volatility, providing excellent support or resistance areas.
The blocks offer cleaner chart presentation with reasonable distribution, volume ratio visualization within each block, and categorization into Strong, High and Balanced blocks.
Additionally, a third line has been introduced to rank order blocks by volume using a modified percent rank method for more precise ranking.
This ranking system uses percentile ranks, a concept commonly used in standardized tests. In the context of order blocks, the percentile rank of a particular order block's volume is interpreted as the percentage of the order blocks strength. This method provides a more nuanced and statistically robust way of comparing and prioritizing order blocks.
Key features:
Cleaner chart presentation with reasonable distribution of blocks
Volume ratio visualization within each block (bullish vs bearish)
Categorization into High and Balanced blocks for easy identification of significant levels
Relative volume percentage and volume delta display
Advanced ranking system using modified percent rank method for volume comparison
These Order Blocks help traders:
Forecast excellent support or resistance areas
Gain insight into the balance of the market at specific levels
Identify significant market levels at a glance
Visualize market imbalances through volume delta
Prioritize order blocks based on their relative volume importance
Make more informed decisions about potential entry and exit points
⬤ Beluga Profile
The Beluga Profile is a revolutionary market analysis tool that transforms complex market data into a clear, intuitive visual narrative. At its core, it combines a Dual-Profile Analysis, merging Delta Volume Profile with Money Flow Profile to give traders a comprehensive view of market dynamics.
The percentage scale on the left side aren't just numbers; they represent the Levels Strength Percentage, a crucial ranking system that immediately draws your attention to the most significant price zones. Complementing this, a heat map overlay brings these strength levels to life, offering an instant, color-coded representation of where the market's most influential areas lie.
To the right, a detailed breakdown of volume and money flow for each level provides the hard data behind the visual cues. This granular information allows you to dive deep into the market's structure, understanding not just where the significant levels are, but why they matter.
Below the main chart, the Delta Volume Bar serves as a foundation, showing the average delta of the volume profile. This bar is more than just a measure of volume – it's a window into the underlying forces driving price movement. Just above this bar, a macro trend indicator in the form of an arrow offers a quick, clear signal of the overall market direction based on these delta volume calculations.
But the Beluga Profile doesn't just show you what's happening – it helps you understand the 'why' and 'how'. The Adaptive Points of Interest feature allows you to customize your analysis, focusing on the areas that matter most to your trading strategy. You can select from various options including Money Flow, Delta+, Delta-, Volume+, and Level % (Highest), tailoring the display to your specific analytical needs. This flexibility ensures you can focus on the most relevant data for your trading style. Real-time Active Price Tracking ensures you're always in sync with the latest market movements.
All of these elements work in concert, creating a symphony of market information. They empower you to:
Spot key price levels with uncanny precision
Foresee potential market turns before they happen
Grasp the quality and strength of price moves
Adjust your strategy on the fly as market conditions shift
Develop a holistic understanding of market structure and participant behavior
Make informed decisions backed by a clear view of the overall market trend
In essence, the Beluga Profile isn't just a tool – it's your market storyteller, translating the complex language of price, volume, and money flow into a narrative that you can understand and act upon with confidence.
⬤ Smart Money Concepts (SMC)
The Smart Money Concepts component of the toolkit focuses on automatically detecting key market structures crucial in technical analysis. It identifies and visualizes Break of Structure (BOS) and Change of Character (CHOCH) patterns, helping traders spot potential trend reversals and significant market movements. This includes BOS identification when price breaks previous support or resistance and CHOCH detection for potential trend reversals, with automatic detection of both bullish and bearish patterns.
The latest enhancement to this feature adds a new layer of analysis through Delta Volume Calculation. When a BOS or CHOCH is detected, the toolkit calculates the delta volume within the range from the high or low point to the break point. This analysis considers all the candles in this range and determines whether the volume is predominantly bullish, bearish, or neutral.
Bullish Volume: If the delta volume is bullish, a green diamond is plotted at the high or low point, indicating potential upward momentum.
Bearish Volume: If the delta volume is bearish, a red diamond is plotted, suggesting downward pressure.
Neutral Volume: When the volume is neutral, a yellow diamond is displayed, indicating a balance in buying and selling forces.
This visual representation of volume dynamics provides an additional layer of insight, helping traders assess the strength and direction of price movements following a structure break. You can see an example of this on the attached image, where the diamonds clearly indicate the type of volume driving the breakout.
The toolkit also incorporates Fair Value Gap (FVG) Detection. Fair Value Gaps represent inefficiencies in the market, where there is an imbalance between buy and sell orders. These gaps often act as magnets for price, potentially leading to future reversals or continuations when filled. The toolkit identifies and highlights these gaps, allowing traders to recognize areas where the market may seek to rebalance.
Additionally, Double Top and Bottom Pattern Detection has been integrated, identifying potential reversal points at these classic price formations. Double tops signal potential bearish reversals after a price peak, while double bottoms suggest potential bullish reversals after a price dip. These patterns can be crucial indicators for traders looking to capitalize on upcoming trend changes.
Smart Money Concepts help traders:
Identify potential trend reversals early with a clearer view of market structure.
Recognize significant changes in market structure and volume participation.
Differentiate between temporary pullbacks and genuine trend changes using volume insights (color coded diamonds).
Shows Fair Value gaps which helps to identify price momentum and inefficiencies in the market.
This enhancement ensures that traders can not only see structural changes but also understand the volume behind those moves, leading to more informed and confident trading decisions.
⬤ Support and Resistance Levels
This powerful tool is designed to identify key price levels in the market, providing traders with a clear visual representation of potential support and resistance areas. It goes beyond simple level identification by incorporating a sophisticated ranking system and adjustable sensitivity.
The grading system of levels is a unique feature that evaluates the significance of high and low points in the price action. It takes into consideration how many times the price has touched or interacted with specific levels. This means that levels which have been tested multiple times are given higher importance in the ranking. For example, a price level that has acted as support or resistance three times will be ranked higher than a level that has only been touched once.
By leveraging this grading system, traders can focus on the most significant levels that have repeatedly influenced price action, potentially improving the accuracy of their trading decisions and risk management strategies.
This Support and Resistance Levels indicator helps traders:
Identify and prioritize potential reversal points based on their historical significance and frequency of price interaction
Set more accurate entry and exit points aligned with key market levels, focusing on those with higher ranking
Understand the hierarchical structure of market support and resistance, distinguishing between major and minor levels
Plan stop-loss and take-profit levels with greater precision, using the ranking to gauge the strength of each level
Adapt their analysis to varying market strengths and volatilities, with the ability to filter out less significant levels
Recognize recurring price patterns and potential breakout levels based on the ranked historical price interactions
⬤ How to Use the Toolkit
Each of these indicators, while powerful on its own, works synergistically with the others to provide a more complete picture of the market.
The strength of this toolkit lies in its ability to analyze the market from multiple perspectives
Combining these advanced trading indicators into a cohesive toolkit empowers traders with a comprehensive, multi-dimensional view of the market that no single indicator could provide on its own. The market's complexity demands an approach that goes beyond relying on just one aspect, such as price action, volume, or order flow. Integrating these diverse indicators creates a robust analytical framework that captures the market from multiple angles, leading to more accurate insights and better-informed decision-making.
Analyze Order Blocks to identify potential support/resistance and volume imbalances
Use Beluga Profile for comprehensive market structure and trend analysis
Monitor SMC indicators for potential trend reversals and breakouts
Utilize Support and Resistance Levels for precise entry/exit points and risk management
Combine insights from all tools for a multi-dimensional view of market conditions
⬤ Customization
Each component of the toolkit offers various customization options to suit different trading styles and preferences. These inputs allow traders to adjust settings to better fit their analysis needs and strategies:
Order Blocks
- Order Blocks : Set the amount of Order Blocks on the chart.
- Color Selection : Choose the color for highlighting the order blocks on your chart.
Market Structure
- Sensitivity : Adjust the sensitivity for detecting market structure breaks. Higher sensitivity will detect more granular breaks, while lower sensitivity focuses on more significant movements.
- Data : Enable or disable the display of market structure data.
- Zigzag Option : Toggle Zigzag displays from highs and lows.
S/R (Support and Resistance)
- Sensitivity : Control how sensitive the tool is in detecting support and resistance levels. Lower sensitivity will highlight fewer but stronger levels, while higher sensitivity may reveal more levels.
- Width % : Adjust the width of the support and resistance zones to visually emphasize their importance.
- Color Selection : Choose colors for both support and resistance levels for better clarity.
FVG (Fair Value Gap)
- Max : Set the maximum number of fair value gaps to display. Higher values will show more gaps, while lower values will focus on the most prominent ones.
- Color Selection : Customize the color for the fair value gap areas.
Volume Profile
- Length : Define the look-back period for the volume profile analysis. A longer length considers more historical data, while a shorter length focuses on recent data.
- Levs : Choose the number of volume levels to display, allowing for more or fewer volume bars within the profile.
- BG : Enable or disable background shading for the volume profile.
- HeatMap : Activate or deactivate the heat map overlay for volume intensity visualization.
- POC (Point of Control) : Toggle the Point of Control display and choose between different metrics, such as volume+, money flow, Delta+ and Delta-, Level % (Highesr), to base the POC on.
- Color Selection : Customize the color for the Point of Control line.
These customization options provide traders with the flexibility to tailor the toolkit to their specific trading strategies, enhancing their ability to identify key market signals with precision.
Each component of the toolkit offers various customization options to suit different trading styles and preferences.
The BigBeluga Market Core Toolkit synthesizes complex market data into clear, actionable formats, providing traders with professional-level insights. It's a comprehensive market analysis system that can give traders a significant edge in understanding market behavior and identifying high-probability trade setups. While highly effective, it's recommended to use this toolkit in conjunction with fundamental analysis and sound risk management practices for optimal trading results.
Paid script

improved volumeIt is an indicator that displays the trading volume.
Red-colored candle bars indicate a decrease in trading volume.
Green-colored candle bars indicate an increase in trading volume.
The transparent yellow cloud above the volume bars represents the 21-bar moving average volume, which shows the average volume over the specified period. (You can change the number of bars and the type of moving average from the indicator settings.)
This allows for easier comparison between the current trading volume and the average volume.
In the price scale section, there are 4 target levels. They represent the following in ascending order: Average volume, Average volume multiplied by 2, Average volume multiplied by 3, Average volume multiplied by 4.
Additionally, you can use the alarm feature based on these average volume levels.

Volume Profile With Buy & Sell Pressure LabelVOLUME PROFILE WITH BUY AND SELL PRESSURE LABEL
This volume profile indicator shows volume traded for each bar and is colored according to the difference in buy and sell pressure(DMI).
***HOW TO USE***
If the bar and background is colored green, there is more market buying than selling on that bar.
If the bar and background is colored red, there is more market selling than buying on that bar.
If the bar and background is colored blue, there is an equal amount of market buying and selling on that bar.
***BUY/SELL LABEL***
There is also a label on the right side that tells you whether there is more buying or selling on the current bar. This table updates in real time and changes colors so you can get an easy, quick interpretation of the current buy/sell pressure without having to look at the volume bars so you can make faster decisions on whether to enter or exit a trade. The table changes colors in sync with the volume bars and background. Green means more market buying than selling. Red means more market selling than buying. Blue means an equal amount of market buying and selling.
***MARKETS***
This indicator can be used as a signal on all markets, including stocks, crypto, futures and forex.
***TIMEFRAMES***
This volume profile indicator can be used on all timeframes.
***TIPS***
Try using numerous indicators of ours on your chart so you can instantly see the bullish or bearish trend of multiple indicators in real time without having to analyze the data. Some of our favorites are our Auto Fibonacci, DMI, Momentum, Auto Support And Resistance and Money Flow Index in combination with this Volume Profile. They all have real time Bullish and Bearish labels as well so you can immediately understand each indicator's trend.

vol difflearn from
change volume bar color vs sma ,
if bar up, volume bar change to orange, volume >20sma, volume change yellow.
if bar down, volume bar change to silver , volume >20sma, volume change black.

Better Volume PRO v2.1 (Enhanced + Stats)(Adaptative metrics) Better Volume PRO v2.0 - Quick Reference Guide
## ⚙️ OPTIMAL SETTINGS
```
Timeframe: 1 HOUR (best balance)
Lookback Period: 20
Min Confidence: 70% (85% in volatile markets)
MA Type: EMA
Stats Lookback: 10
Use True Range: ON
Use VWAP: ON
Filter Doji: ON
Multi-Bar Consistency: ON
```
## 🎯 SIGNAL CONDITIONS
### 🟢 BUY Signal
```
✓ Delta > 0 (more buying pressure)
✓ Confidence ≥ 70%
✓ Climax OR Hot Volume
```
### 🔴 SELL Signal
```
✓ Delta < 0 (more selling pressure)
✓ Confidence ≥ 70%
✓ Climax OR Hot Volume
```
### 🔥 HOT Volume
```
Volume > 160% of Volume MA
= Sudden capital influx
```
## 📊 CONFIDENCE SCORE (0-100%)
### Components:
- **40%** Structure (candle body vs wicks)
- **30%** VWAP coherence
- **20%** Volume relative to MA
- **10%** Multi-bar consistency
### Interpretation:
| Range | Quality | Accuracy | Action |
| --- | --- | --- | --- |
| **85-100%** | 🟢 MAXIMUM | 100% | Trade with full confidence |
| **70-85%** | 🟡 HIGH | 67% | Trade with caution |
| **50-70%** | 🟠 MEDIUM | 45% | Context only - don't trade |
| **<50%** | 🔴 LOW | 45% | Ignore completely |
## 📈 TABLE METRICS - QUICK REFERENCE
### CURRENT (single candle):
| Metric | Meaning | Good Value |
| --- | --- | --- |
| **Confidence** | Signal quality | ≥70% |
| **Delta** | Buy - Sell volume | Large absolute value |
| **Vol Excess** | % above MA | ≥60% = Hot |
### AGGREGATED (last N candles):
| Metric | Meaning | Bullish | Bearish |
| --- | --- | --- | --- |
| **Avg Confidence** | Average quality | >70% | >70% |
| **Cum. Delta** | Net accumulation | >0 (positive) | <0 (negative) |
| **Buy Pressure** | % buy candles | >60% | <40% |
| **Net Pressure** | Combined score | >+30 | <-30 |
| **High Conf Count** | Quality consistency | >5/10 | >5/10 |
| **Delta Momentum** | Delta acceleration | Increasing | Decreasing |
| **Volume Trend** | Volume vs avg | Increasing | Increasing |
## ✅ 4-STEP TRADING CHECKLIST
### STEP 1: Context Check (CRITICAL)
```
□ Avg Confidence >70%?
□ Net Pressure supports direction? (>+30 for LONG, <-30 for SHORT)
□ High Conf Count >50%?
If ANY = NO → SKIP THE TRADE
```
### STEP 2: Signal Validation
```
□ BUY or SELL signal present?
□ Confidence ≥70%? (≥85% preferred)
□ Hot Volume or Climax confirming?
```
### STEP 3: Metrics Alignment
```
FOR LONG:
□ Delta > 0 and large
□ Buy Pressure >50%
□ Cum. Delta positive
□ Net Pressure >+10
FOR SHORT:
□ Delta < 0 and large
□ Sell Pressure >50%
□ Cum. Delta negative
□ Net Pressure <-10
```
### STEP 4: Risk Management
```
□ Stop-loss set
□ Position sized based on confidence
□ Monitoring next bars
```
## 🚦 MARKET STATE INTERPRETATION
### 🟢 STRONG LONG SETUP
```
Signal: BUY
Confidence: ≥85%
Delta: Large positive
Net Pressure: >+50
Avg Confidence: >70%
Volume Trend: Increasing
→ TAKE LONG WITH HIGH CONVICTION
```
### 🔴 STRONG SHORT SETUP
```
Signal: SELL
Confidence: ≥85%
Delta: Large negative
Net Pressure: <-50
Avg Confidence: >70%
Volume Trend: Increasing
→ TAKE SHORT WITH HIGH CONVICTION
```
### 🟡 NEUTRAL / CHOPPY
```
Net Pressure: -30 to +30
Avg Confidence: <60%
High Conf Count: <5/10
→ NO TRADE - Wait for clarity
```
### ⚠️ CONTRADICTORY SIGNAL
```
Signal: BUY
BUT Net Pressure: Negative
AND Sell Pressure: >60%
OR Avg Confidence: <50%
→ SKIP - Isolated signal in bad context
```
## ⚡ QUICK TIPS
### DO ✅
- ✓ Use 1H timeframe (optimal)
- ✓ Only trade confidence ≥70%
- ✓ Check context BEFORE signal
- ✓ Combine with on-chain data (Nansen)
- ✓ Trade liquid tokens (>$1M volume)
- ✓ Use stop-loss always
### DON'T ❌
- ✗ Use 5-15min timeframes (too noisy)
- ✗ Ignore aggregated metrics
- ✗ Trade during strong corrections
- ✗ Use on illiquid tokens
- ✗ Trade all signals (quality > quantity)
- ✗ Over-optimize settings
## 🎨 VISUAL REFERENCE
### Signal Shapes:
- **▲ Green Triangle (bottom):** BUY Signal
- **▼ Red Triangle (top):** SELL Signal
- **♦ Orange Diamond (top):** HOT Volume
- **✕ Green/Red X:** Bullish/Bearish Divergence
### Volume Bars:
- **Green (up):** Buy Volume estimate
- **Red (down):** Sell Volume estimate
- **Colors by BV Class:**
- 🟣 Purple: Climax + Churn
- 🟢 Green: Climax Up
- 🔴 Red: Climax Down
- 🟡 Yellow: Churn
- 🔵 Blue: Low Volume
- ⚪ Gray: Normal
### Lines:
- **Yellow:** Volume MA
- **Green/Red (thick):** Delta (transparency = confidence)
- **Blue (thin):** Confidence line
- **Orange dashed:** Min Confidence threshold
## 📊 NET PRESSURE SCORE GUIDE
```
+80 to +100: 🟢🟢🟢 EXTREME BUYING (consider strong LONG)
+50 to +80: 🟢🟢 STRONG BUYING
+30 to +50: 🟢 MODERATE BUYING
-30 to +30: 🟡 NEUTRAL (no clear direction - WAIT)
-50 to -30: 🔴 MODERATE SELLING
-80 to -50: 🔴🔴 STRONG SELLING
-100 to -80: 🔴🔴🔴 EXTREME SELLING (consider strong SHORT)
```
## 🔬 EXPECTED ACCURACY
### Solo BV PRO:
- **Confidence ≥85%:** ~100% (limited samples)
- **Confidence ≥70%:** ~70%
- **Trending markets:** Better performance
- **Volatile corrections:** Lower performance (~40%)
### Combined BV PRO + On-Chain:
- **Expected:** ~80%+ accuracy
- **Filters false signals** from retail traps
- **Confirms institutional positioning**
## ⚠️ WHEN TO AVOID TRADING
```
✗ Avg Confidence <60% (choppy market)
✗ Net Pressure -30 to +30 (no clear direction)
✗ High Conf Count <30% (inconsistent signals)
✗ Volume Trend <-30% (drying liquidity)
✗ Strong market correction ongoing
✗ Major news event imminent
✗ Illiquid token (<$100K daily volume)
```
## 🎓 REMEMBER
1. **Context > Signal:** Never trade signal without checking aggregated metrics
2. **Quality > Quantity:** 7 high-quality signals >> 120 low-quality signals
3. **Combine Tools:** BV PRO (technical) + Nansen (on-chain) = Best results
4. **Risk Management:** Always use stop-loss, even with 100% confidence
5. **Market Conditions:** Indicator performs differently in trending vs choppy markets
---
**Version:** 2.0 | **Optimal TF:** 1H | **Min Confidence:** 70% (85% volatile)
**Created by:** Joe | **License:** Open Source

DeltaFlow Volume Profile [BigBeluga]🔵 OVERVIEW
The DeltaFlow Volume Profile builds a compact volume profile next to price and enriches every bin with flow context : bullish vs. bearish participation (%), a per-bin Delta % , an optional Delta Heat Map , and a PoC band with the bin’s absolute volume. This lets you see not just where volume clustered, but who (buyers or sellers) dominated inside each price slice.
🔵 CONCEPTS
Binned Volume Profile : Price range over a user-defined LookBack is split into Bins ; each bin aggregates traded volume.
Bull/Bear Split : Within every bin, volume is separated by candle direction into Bull Volume and Bear Volume , then normalized to % of the bin’s displayed size.
Delta % : The difference between Bull % and Bear % for the bin. Positive = buyer dominance; negative = seller dominance.
Delta Heat Map : Bin background shading that scales with both total volume strength and delta bias.
PoC (Point of Control) : The most significant bin gets a PoC band and a label with its absolute volume.
🔵 FEATURES
Profile with Flow : A clean horizontal volume bar per bin plus stacked Bull % and Bear % .
Per-Bin Delta Label : A readable “Δ xx%” tag at the start of each bin shows dominance at a glance.
Delta Heat Map : Optional gradient that intensifies with higher volume and stronger delta.
PoC Highlight : Optional PoC band colored separately, labeled with absolute volume (e.g., “1.23M”).
Configurable Inputs : LookBack, number of Bins (10–100), toggles for Delta, Heat Map, Volume Bars, and PoC color.
Readable Colors : Separate inputs for bullish (volume +) and bearish (volume –) hues.
🔵 HOW TO USE
Set the window : Choose LookBack and Bins to balance detail vs. performance (more bins = finer resolution).
Enable “Volume Bars” to display the bull/bear split as two stacked percent bars inside each bin.
High Bull % near support → constructive demand.
High Bear % near resistance → active supply.
Use Δ labels (toggle “Delta”) to quickly spot bins with clear buyer/seller control; combine with price position for confluence.
Turn on Delta Heat Map to prioritize areas with both large volume and strong imbalance.
Watch the PoC : The PoC band marks the most traded (and often magnet) level; its label shows absolute size for context.
Trade ideas :
Breakout continuation when Δ stays positive across consecutive upper bins.
Reversion risk when price enters a large bearish-Δ cluster below.
Manage risk around the PoC; reactions there can be sharp.
🔵 CONCLUSION
DeltaFlow Volume Profile upgrades a classic profile with flow intelligence. The bull/bear split, explicit Δ %, heat-weighted backdrop, and PoC volume label make dominant participation and key price shelves obvious. Use it to filter levels, time entries with imbalance, and validate breakouts or fades with objective volume-flow evidence.

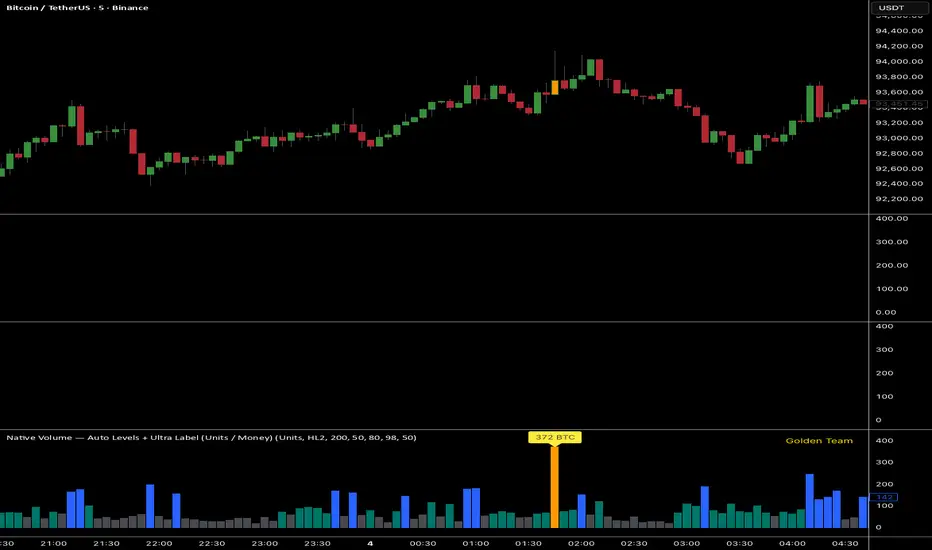
Ultra Volume DetectorNative Volume — Auto Levels + Ultra Label
What it does
This indicator classifies volume bars into four categories — Low, Medium, High, and Ultra — using rolling percentile thresholds. Instead of fixed cutoffs, it adapts dynamically to recent market activity, making it useful across different symbols and timeframes. Ultra-high volume bars are highlighted with labels showing compacted values (K/M/B/T) and the appropriate unit (shares, contracts, ticks, etc.).
Core Logic
Dynamic thresholds: Calculates percentile levels (e.g., 50th, 80th, 98th) over a user-defined window of bars.
Categorization: Bars are colored by category (Low/Med/High/Ultra).
Ultra labeling: Only Ultra bars are labeled, preventing chart clutter.
Optional MA: A moving average of raw volume can be plotted for context.
Alerts: Supports both alert condition for Ultra events and dynamic alert() messages that include the actual volume value at bar close.
How to use
Adjust window size: Larger windows (e.g., 200+) provide stable thresholds; smaller windows react more quickly.
Set percentiles: Typical defaults are 50 for Medium, 80 for High, and 98 for Ultra. Lower the Ultra percentile to see more frequent signals, or raise it to isolate only extreme events.
Read chart signals:
Bar colors show the category.
Labels appear only on Ultra bars.
Alerts can be set up for automatic notification when Ultra volume occurs.
Why it’s unique
Adaptive: Uses rolling statistics, not static thresholds.
Cross-asset ready: Adjusts units automatically depending on instrument type.
Efficient visualization: Focuses labels only on the most significant events, reducing noise.
⚠️ Disclaimer: This tool is for educational and analytical purposes only. It does not provide financial advice. Always test and manage risk before trading live
Extreme Zone Volume ProfileExtreme Zone Volume Profile (EZVP)
Originality & Innovation
The Extreme Zone Volume Profile (EZVP) revolutionizes traditional volume profile analysis by applying statistical zone classification to volume distribution. Unlike standard volume profiles that display raw volume data, EZVP segments the price range into statistically meaningful zones based on percentile thresholds, allowing traders to instantly identify where volume concentration suggests strong support/resistance versus areas of potential breakout.
Technical Methodology
Core Algorithm:
Distributes volume across user-defined bins (20-200) over a lookback period
Calculates volume-weighted price levels for each bin
Applies percentile-based zone classification to the price range (not volume ranking)
Zone B (extreme zones): Outer percentile tails representing potential rejection areas
Zone A (significant zones): Secondary percentile bands indicating strong interest levels
Center Zone: Bulk trading range where most price discovery occurs
Mathematical Foundation:
The script uses price-range percentiles rather than volume percentiles. If the total price range is divided into 100%, Zone B captures the extreme price tails (default 2.5% each end ≈ 2 standard deviations), Zone A captures the next significant bands (default 14% each ≈ 1 standard deviation), leaving the center for normal distribution trading.
Key Calculations:
POC (Point of Control): Price level with maximum volume accumulation
Volume-weighted mean price: Total volume × price / total volume
Median price: Geometric center of the price range
Rightward-projected bars: Volume bars extend forward from current time to avoid historical chart clutter
Trading Applications
Zone Interpretation:
Zone B (Red/Green): Extreme price levels where volume suggests strong rejection potential. Price reaching these zones often indicates overextension and possible reversal points.
Zone A (Orange/Teal): Significant support/resistance areas with substantial volume interest. These levels often act as intermediate targets or consolidation zones.
Center (Gray): Fair value area where most trading occurs. Price tends to return to this range during normal market conditions.
Strategic Usage:
Reversal Trading: Look for rejection signals when price enters Zone B areas
Breakout Confirmation: Volume expansion beyond Zone B boundaries suggests genuine breakouts
Support/Resistance: Zone A boundaries often provide reliable entry/exit levels
Mean Reversion: Price tends to gravitate toward the volume-weighted mean and POC lines
Unique Value Proposition
EZVP addresses three key limitations of traditional volume profiles:
Visual Clarity: Standard profiles can be cluttered and difficult to interpret quickly. EZVP's color-coded zones provide instant visual feedback about price significance.
Statistical Framework: Rather than relying on subjective interpretation of volume nodes, EZVP applies objective percentile-based classification, making support/resistance identification more systematic.
Forward-Looking Display: Rightward-projecting bars keep historical price action clean while maintaining current market structure visibility.
Configuration Guide
Lookback Period (10-1000): Controls the historical depth of volume calculation. Shorter periods for intraday scalping, longer for swing trading.
Number of Bins (20-200): Resolution of volume distribution. Higher values provide more granular analysis but may create noise on lower timeframes.
Zone Percentages:
Zone B: Extreme threshold (default 2.5% = ~2σ statistical significance)
Zone A: Significant threshold (default 14% = ~1σ statistical significance)
Visual Controls: Toggle individual elements (POC, median, mean, zone lines) to customize display complexity for your trading style.
Technical Requirements
Pine Script v6 compatible
Maximum bars back: 5000 (ensures sufficient historical data)
Maximum boxes: 500 (supports high-resolution bin counts)
Maximum lines: 50 (accommodates all zone and reference lines)
This indicator synthesizes volume profile theory with statistical zone analysis, providing a quantitative framework for identifying high-probability support/resistance levels based on volume distribution patterns rather than arbitrary price levels.

Volume with High Volume SignalsIndicator Description for Promotional Post (in English)
Unlock Market Insights with the "Volume with High Volume Signals" Indicator!
Are you ready to take your trading to the next level? The Volume with High Volume Signals indicator is your ultimate tool for spotting critical market movements driven by volume surges. Designed for traders who want clarity and precision, this Pine Script indicator combines powerful volume analysis with customizable features to help you stay ahead of the game.
Why Choose This Indicator?
Dynamic Volume Visualization: Watch volume bars come to life with customizable coloring. Choose to color bars based on candle direction (green for bullish, red for bearish) or use a neutral gray for a clean look.
High Volume Detection: Instantly spot significant volume spikes with our advanced highlighting feature. When volume exceeds twice the Simple Moving Average (SMA), bars are highlighted in a bold, customizable color (default: yellow) to signal potential breakout or reversal opportunities.
Dual Moving Averages: Track volume trends with both Simple Moving Average (SMA) and Exponential Moving Average (EMA). Fully customizable periods, colors, and line thickness let you tailor the indicator to your trading style.
Visual Alerts for Key Moments: When volume surges above both SMA and EMA, a vibrant fuchsia triangle appears above the bar, giving you an immediate visual cue for high-impact market activity.
User-Friendly Customization: Adjust every aspect of the indicator—toggle SMA/EMA visibility, set periods, choose colors, and fine-tune line thickness to match your preferences.
Perfect For:
Day traders looking for high-volume breakouts.
Swing traders identifying trend reversals.
Any trader who wants to harness volume as a leading indicator.
Why It’s a Must-Have:
Volume is the heartbeat of the market, and this indicator transforms raw data into actionable insights. Whether you're scalping, swing trading, or analyzing long-term trends, the Volume with High Volume Signals indicator empowers you to make informed decisions with confidence.
Get Started Today!
Add the Volume with High Volume Signals indicator to your TradingView arsenal and start decoding market moves like a pro. Don’t miss out on the edge that top traders rely on—grab this indicator now and elevate your trading strategy!
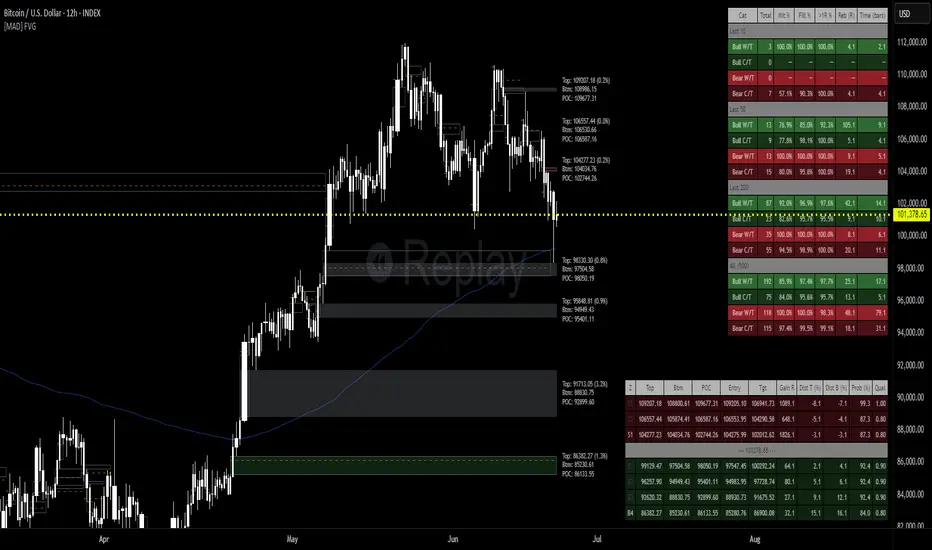
[MAD] FVG with LTF-POC/TPOOverview
The Fair Value Gap (FVG) Detector is a precision tool designed to automatically identify, draw, and track market inefficiencies. These gaps, also known as imbalances, often act as powerful magnets for future price action.
This indicator handles the entire lifecycle of an FVG: from its creation and extension, to the moment it is first touched, and through its entire mitigation process. To add an even deeper layer of analysis, it can now optionally plot two types of micro-analysis lines for the middle candle of the FVG pattern: a volume-based Point of Control (LTF-POC) and a time-based Time Price Opportunity (LTF-TPO). These high-precision lines pinpoint the most significant price levels within the imbalance itself.
By providing a clean and objective visualization of these critical price zones, the FVG Detector gives traders a clear framework for spotting high-probability setups and understanding how the market returns to areas of inefficiency to become balanced once again.
█ How It Works
The indicator’s logic is built on precise detection, dynamic visualization, and intelligent state tracking to provide a comprehensive view of market imbalances.
⚪ The FVG Detection Engine
At its core, the indicator uses a classic three-candle pattern to identify FVGs. This mechanical definition removes all subjectivity:
Bullish FVG: A gap is identified when the high of the first candle is lower than the low of the third candle. The space between these two prices creates the bullish FVG.
Bearish FVG: A gap is identified when the low of the first candle is higher than the high of the third candle. The space between these two prices creates the bearish FVG.
⚪ Dynamic Drawing and Mitigation
Once an FVG is detected, the indicator automatically draws a colored box to represent the gap. This box is then managed through its entire lifecycle:
Extension: If enabled, the FVG box extends forward in time with each new candle, acting as a visible, forward-looking zone of interest.
Partial Mitigation Trigger: The moment price first "touches" the gap, the box changes color to signal that it is no longer a fresh, unmitigated zone. The statistics table counts this as a "Partially Mitigated" event.
Shrinking FVG: As price moves further into the gap, the colored box dynamically shrinks, providing a real-time visual of how much of the imbalance has been filled.
Historical Outline: An optional secondary outline box is drawn to preserve the FVG's original size. This outline stops extending when the FVG is first touched, leaving a permanent historical marker.
⚪ Optional LTF Analysis for Added Precision
The indicator can look "inside" the FVG's middle candle to find its most significant price levels.
LTF-POC (Volume-Based): Using data from a lower timeframe, it analyzes the volume profile of the FVG-creating candle to find the single price level from the lower-timeframe bar with the highest trading volume.
LTF-TPO (Time-Based): It also identifies the Time Price Opportunity by dividing the candle's price range into distinct "bins." The script counts how many lower-timeframe price ticks occurred in each bin, and the TPO line is drawn at the center of the busiest bin.
Visual Confluence: These are drawn as distinct horizontal lines (defaulting to orange for POC and yellow for TPO) that extend and are managed alongside the FVG's historical outline, serving as precise levels of interest within the broader FVG zone.
█ Why This Indicator is Different
While many traders can spot FVGs manually, this indicator offers a significant edge through the possibility of the lowertimeframe analysis and showing the syntetic TPO or POCs for the relevant candles.
⚪ Automated and Objective
The market moves fast, and manually drawing FVGs is impractical and prone to error. This tool automates the entire process.
Never Miss a Gap: The detector impartially scans every three-candle sequence, ensuring no FVG is missed.
No Subjectivity: The rules for detection, mitigation, and LTF analysis are based on fixed mathematical models, removing subjective judgment.
Multi-Timeframe Clarity: The indicator works flawlessly on any timeframe, allowing you to maintain a consistent view of market structure.
⚪ Visualizing Market Memory
This tool does more than just draw boxes; it tells a story. Watching a box change color and shrink provides a visual of market dynamics in action. The optional historical outlines and LTF analysis lines build a "map" on your chart, showing where significant reactions and high-liquidity zones occurred in the past, which provides invaluable context for future price movements.
█ How to Use
⚪ Identifying High-Probability Zones
The primary use of the FVG Detector is to identify high-probability zones where price may react.
Entries: Unmitigated (fresh) FVGs can serve as powerful entry zones. Traders may look for price to return to a bullish FVG to take a long position, or to a bearish FVG to take a short position.
Targets: An FVG in your path can also act as a logical profit target. For example, if you are in a long position, you might take profit as price fills a nearby bearish FVG above you.
⚪ Confluence and Confirmation
FVGs are most powerful when they align with other forms of technical analysis. Look for FVGs that have "confluence" with:
Market Structure: A bullish FVG found at a key support level or after a bullish break of structure is a higher-probability setup.
Order Blocks: An FVG that overlaps with a bullish or bearish order block creates a very potent point of interest.
Premium/Discount Zones: FVGs found deep in a premium (for shorts) or discount (for longs) area of a trading range often yield strong reactions.
The LTF Lines (POC & TPO): Use these lines as a source of internal confluence. While the FVG gives you a zone, the POC and TPO give you precise levels within that zone. The POC shows where the highest volume was traded, while the TPO shows where price spent the most time. Confluence between these two lines can signal an extremely strong level.
█ Settings
Max Number of FVGs to Display: Controls how many active FVGs are kept on the chart to prevent clutter and maintain performance.
Extend Unmitigated FVGs: When enabled, FVG boxes will extend to the right until price touches them.
Show Bullish/Bearish FVGs: Toggles the visibility of bullish or bearish FVGs.
Show FVG Labels: Toggles the visibility of the "FVG" text labels.
Keep Mitigated Outlines: If checked, the historical outline box (and its associated POC/TPO lines) will remain on the chart even after the FVG is completely filled.
Show Statistics: Toggles the visibility of the statistics table, which tracks total, partly mitigated, and fully mitigated FVGs.
Show LTF-TPO (Time-Based): Toggles the calculation and display of the Time Price Opportunity line.
Show LTF-POC (Volume-Based): Toggles the calculation and display of the Point of Control line.
Use Custom LTF for Analysis: Check this to manually select a timeframe for the POC/TPO calculation. If unchecked, the script auto-selects a lower timeframe.
Lower Timeframe: The specific lower timeframe to use when the "Custom LTF" box is checked.
Magnifier (Bars per Slice): Controls how the script auto-selects a lower timeframe (higher number = lower timeframe). Only active when "Custom LTF" is unchecked.
█ The Logic Explained
This indicator uses a clear, rules-based system based on mathematical and conditional principles.
The 3-Candle FVG Pattern
The detection engine precisely identifies FVGs by comparing the price extremes of a three-candle sequence. For a bullish FVG, it confirms that the high of the first candle is strictly below the low of the third candle. For a bearish FVG, the low of the first candle must be strictly above the high of the third. This leaves an objective, unfilled gap in the market.
The Mitigation and Shrinking Process
Once an FVG is created, the indicator monitors it on every subsequent bar. The moment a candle's price action enters the FVG's zone, it's flagged as "partially mitigated," and its color changes. The script then continues to track how far price pushes into the gap, dynamically shrinking the box to visually represent the remaining imbalance.
Lower-Timeframe (LTF) Analysis Explained
To add precision, the indicator performs a micro-analysis of the middle candle of the FVG pattern. This is achieved by mathematically deconstructing that single candle using data from a smaller timeframe.
The lower timeframe is determined either manually or automatically via the Magnifier. The Magnifier works by dividing the chart's current timeframe. For example, on a 60-minute chart, a Magnifier of 60 tells the indicator to perform its analysis using 1-minute data (60÷60=1).
Once the LTF data is obtained, two calculations are performed:
LTF Point of Control (Volume-Based): This method seeks the price of maximum commitment. The indicator analyzes the volume of every single lower-timeframe bar within the main candle and identifies the one bar with the highest trading volume. The closing price of that specific high-volume bar is designated as the POC.
LTF Time Price Opportunity (Time-Based): This method finds the price where the market spent the most time trading. The process is a form of price distribution analysis:
The total price range (high to low) of the main candle is measured.
This range is divided into 40 equal price zones, or "bins". For a candle with a $2 range, each bin would represent a price slice of 5 cents
The indicator then counts how many of the lower-timeframe closing prices fall within each of the 40 bins.
The TPO line is drawn at the midpoint of the single bin that contained the most prices, representing the "busiest" price level.
Time-Based Drawing for Accuracy
To ensure perfect alignment across all historical data and chart reloads, all drawings are anchored to the precise timestamp of the bar, not its sequential position on the chart. This robust method guarantees that all zones remain fixed and accurate regardless of how much historical data is loaded.
█ Disclaimer
Investors are fully responsible for any investment decisions they make.
Have fun trading :-)
Z-Score Volume with CVD ConfirmationZ-Score Volume with CVD Confirmation is a volume-based confluence tool that enhances traditional volume analysis by combining Z-Score volume anomalies with Cumulative Volume Delta (CVD) confirmation. This indicator helps traders identify unusual volume activity that aligns with directional order flow, offering a cleaner signal for potential breakout or reversal scenarios.
🔍 Key Features:
Z-Score Calculation: Measures how extreme current volume is relative to its recent average, highlighting statistically significant surges or drops.
CVD Confirmation: Uses Cumulative Volume Delta candles (open/high/low/close) to assess buying vs. selling pressure in lower timeframes.
Bar Color Logic:
Green: High Z-Score volume confirmed by CVD bullish candle
Red: High Z-Score volume confirmed by CVD bearish candle
Other color bands show progressively strong or weak volume outliers
Real Volume Bar Heights: Volume bars retain true scale while color reflects underlying order flow strength and direction.
💡 Use Cases:
Breakout validation: Confirm price range breaks when volume surge is supported by CVD direction
Fade setups: Detect unsustainable high-volume moves lacking CVD support
Trend continuation: Spot momentum when both Z-Score and CVD align in the direction of the trend
⚙️ How to Use:
Adjust the Z-Score length to define how far back to measure average and deviation.
Select your anchor timeframe (typically 1D) and a lower timeframe for CVD calculations (e.g., 1-minute).
Use color-coded volume bars to assess volume significance and directional flow at a glance.
Add the standard volume indicator to the chart so one can compare the difference between the standard volume indicator and the Z-Score Volume with CVD Confirmation script. Useful at specific price levels and exiting ranges or not.

Volume Delta with PVSRAVolume Delta with PVSRA
Volume Delta with PVSRA is an advanced volume indicator that dissects each bar’s volume into its directional components using higher resolution data. It visually distinguishes between buying and selling volume, so that for a bullish candle the bottom portion represents buying volume and for a bearish candle it represents selling volume. A dot is plotted at the 50% mark of the candle’s total volume, serving as a clear reference point.
Key Features:
Directional Volume Breakdown:
The indicator calculates the delta volume by analyzing lower timeframe data. The bottom portion of a bullish candle (displayed in green) represents buying volume, while that of a bearish candle (displayed in red) represents selling volume.
PVSRA Analysis:
Using Price-Volume Spread Range Analysis, the indicator compares the current volume to the 10-bar average. When volume is significantly higher (using thresholds of 150% and 200%), the candle borders are highlighted in custom colors, indicating medium or strong volume conditions.
Volume Moving Averages:
Three moving averages are plotted:
Total Volume MA (yellow): Tracks overall volume.
Buying Volume MA (green) and Selling Volume MA (red): These are re-centered around the total volume MA. A crossover of the green over the red typically signals rising buying pressure, while the opposite indicates increasing selling pressure.
Scalable Volume Bars:
The indicator scales the volume bars to provide optimal visualization on your chart.
Setup Instructions:
For best results, open your chart settings, navigate to the Canvas tab, and set the bottom margin to 0%. This ensures the indicator displays like a standard volume indicator without any unwanted gaps at the bottom.
Customize the various settings—including colors, border opacity, and moving average parameters—to suit your trading style.

Expanding Volume Range with Anchored VWAPExpanding Volume Range with Anchored VWAP Indicator Summary
This Pine Script indicator is designed for intraday trading, particularly for timeframes of 60 minutes or less. It combines several technical analysis concepts to provide traders with a comprehensive view of price action, volume, and potential support/resistance levels.
## Key Features
1. **Anchored VWAP (Volume Weighted Average Price)**
- Calculates and displays an Anchored VWAP line
- Resets at the start of each new day or when a new highest volume bar is detected
2. **Expanding Volume Range (EVR)**
- Identifies and highlights high volume bars
- Creates a box around the price range of the last three high volume bars
- Generates additional support/resistance lines based on this range
3. **Custom Multiplier Calculations**
- Allows users to customize the calculation of support/resistance levels
- Includes options for separate top and bottom multipliers
- Provides an exponential adjustment for fine-tuning
4. **Volume-Based Candle Coloring**
- Colors candles differently based on their volume relative to recent history
- Highlights the first candle of each session in a distinct color
5. **VWAP-Based Line and Fill Colors**
- Changes colors of lines and fills based on price position relative to VWAP
6. **Alert Generation**
- Creates alerts when price breaks above or below the EVR high and low levels
## User Inputs
The indicator offers several customizable inputs grouped into categories:
1. **Volume Colors**
- Customize colors for various elements (lines, fills, candles) based on volume and VWAP relationship
2. **Target Levels**
- Set multipliers for calculating target levels
3. **Multiplier Calculations**
- Enable/disable custom multiplier calculations
- Set base multipliers and exponents for top and bottom levels
## Functionality Breakdown
1. The indicator tracks the highest volume bars for the current and previous day.
2. It creates an Expanding Volume Range (EVR) based on the last three high volume bars.
3. Using the EVR, it calculates and draws support and resistance levels.
4. The levels can be calculated using either simple multipliers or a more complex exponential formula, depending on user preference.
5. Candles are colored based on their volume and whether they're the first candle of a session.
6. An Anchored VWAP is calculated and displayed, resetting at the start of each day or on new highest volume bars.
7. Alerts are generated when price moves beyond the EVR high or low levels.
## Use Cases
This indicator can be particularly useful for:
- Identifying potential support and resistance levels based on high volume price action
- Spotting changes in volume patterns throughout the trading session
- Recognizing price action relative to the Anchored VWAP
- Setting up potential entry and exit points based on the expanding volume range
Traders should use this indicator in conjunction with other forms of analysis and risk management strategies for best results.

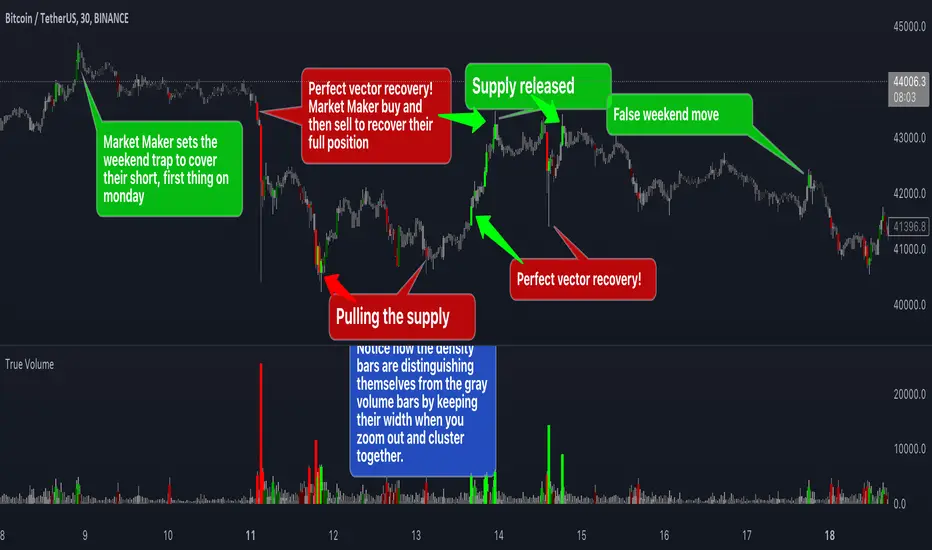
True VolumeThis indicator is designed to provide in-depth analysis of volume data from multiple sources and distinguish highly liquid candles by measuring the density of the volume. By focusing on the density and concentration of volume, rather than just the volume itself, it offers a more nuanced view of the market. This can be particularly beneficial in markets like cryptocurrencies, where understanding the role of market makers versus retail traders is crucial for strategic trading.
This is how it works:
Multiple Asset Integration:
Unlike standard volume indicators, True Volume allows the inclusion of up to four different assets (or the same asset from various exchanges) into its volume calculations. This feature provides a broader and more accurate total volume representation, essential in markets like cryptocurrencies where volume is dispersed across multiple exchanges.
Adjustable Time Anchors:
It offers various time anchor options, allowing traders to analyze volume data over different time periods or a specific amount of lookback candles. This flexibility helps in understanding volume trends over both short and long-term time frames.
Volume Density Analysis:
The core of this indicator is the innovative concept of Volume Density. It's calculated using a sigmoid function that normalizes the volume-to-price movement ratio in a unique way without needing a max cap or having the density column spike off the chart. This method helps in distinguishing between normal volume fluctuations and those that are unusually dense for the given price movement. This distinction is key in identifying potential market maker activities.
The Visuals:
The Volume Density is displayed in a unique way without compromising the original volume bars or cap the density. Infinite density can essentially be represented without having an infinitely large bar or caping out the density data. There's also two different color themes, optional bar color, and an option to flip the density bars up-side down for a different representation. Each of the original volume sources can be displayed separately as well. All colors as customizable as well for your own preference.
Price Volume Trend (PVT):
Included in this indicator is also the Price Volume Trend, which cumulatively measures the density delta, offering insights into the longer-term momentum of the market.
How do I trade it?
This indicator aims to give you insight into 'the other side of the trade', the Market Makers. When you buy, they provide liquidity by selling to you. That drives the Volume Density up.
Consider whether the market maker is currently long or short and might need to cover their position by wicking price back, or "adjust inventory". Especially towards the end of a market session.
Consider dense candles during market gaps or weekends to be market manipulation moves.
The density also goes up when stop losses are hit. If price makes a higher high or lower low, high density could indicate a liquidation event.
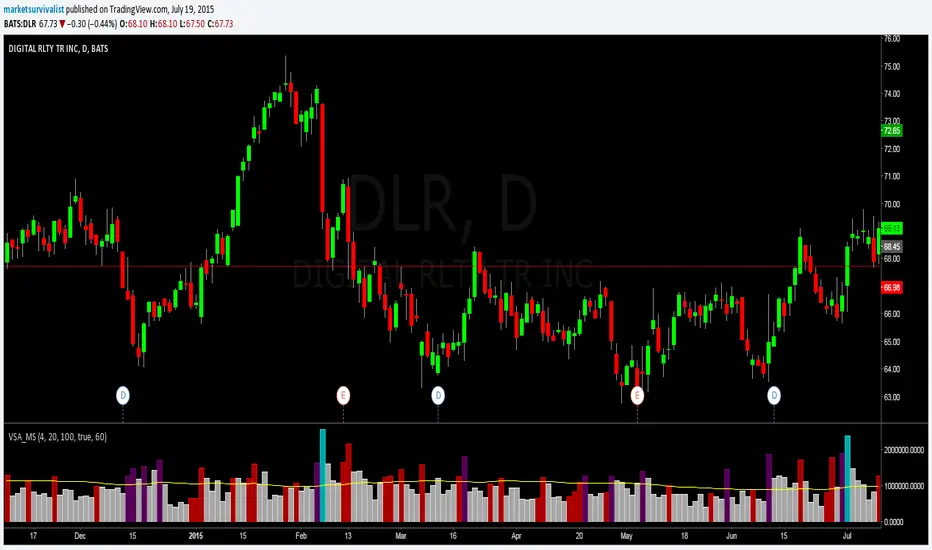
TradeGuider VSA Relative VolumeThe TradeGuider VSA Lite package is designed for those traders who want to trade in harmony with the professionals (‘smart money’) and is based on Tom Williams’ Volume Spread Analysis methodology ( VSA ). It works in any market and any time frame. The trader can use it as a standalone toolkit to support their trading decisions, or in conjunction with other trading tools to obtain additional confirmations.
The package consists of two parts:
TradeGuider VSA Lite indicator
TradeGuider Relative Volume indicator
Together with the TradeGuider VSA Lite indicator, the TradeGuider VSA Relative Volume indicator helps to determine the interaction between supply and demand as well as assisting traders in their trading decisions. In the VSA methodology all analysis is based on Relative Volume . This means that the exact values of the volume on the price bars are not nearly as important as their volume in relation to the previous volume bars. The following classifications of Relative Volume are used in VSA:
Ultra High Volume
Very High Volume
High Volume
Average Volume
Low Volume
Very Low Volume
Users can easily see how any volume bar is classified by observing which color band in the volume indicator is reached by the top of any given volume bar.
Price bars where the volume is Ultra High very often begin the VSA Setup, while price bars on Low or Very Low Volume can be the confirmation and end the VSA Setup.
Using this indicator, users may also observe bullish (when price falls and volume decreases) and bearish (when price rises and volume decreases) behavior.
See the Author's instructions below to get access to this package and the accompanying documentation.

Pivot Boss - Advanced Volume IndicatorThis indicator measures "Compression and Expansion" of current bars volume against 10 day average volume(Can be user defined)
Avg Volume = 10 day avg volume
Wide volume = AvgVolume x 1.25 (Volume bar will be Blue color)
Narrow Volume = AvgVolume x 0.65 (Volume bar will be Magenta color)
Yellow line -- 5 bar avg volume
White Line -- 10 bar avg volume

Bitfinex Spot vs Margin Volume - Multi-assetThe Bitfinex Spot vs Margin Volume - Multi-asset indicator was designed to help understanding how volume is composed between Spot and Margin transactions, considering all possible scenarios.
It provides valuable additional insight on how 'smarter money' is behaving in anticipation of possible upcoming moves, and can contribute to current analysis toolkits.
To request access, please send me a direct message.
Main features:
Spot vs. Margin insight for all margin-enabled Bitfinex pairs (dynamically detected from Chart).
Can be used on non-Bitfinex Charts which share same Ticker (eg. BTCUSD on Bitfinex or Bitstamp). Also dynamically detected.
Can be used in a separate pane (default) or added to main chart, as a standard volume indicator.
Shapes' meanings:
Colored bars represent scenario where maximum possible volume is attributed to Spot transactions (and its corresponding effect on Margin, if any).
Histograms (thin bars) represent scenario where maximum possible volume is attributed to Margin transactions (and its corresponding effect on Spot, if any).
When volume information leaves room for ambiguity, there will be a mismatch between maximums and minimums. Truth will be somewhere in the middle.
By default, Spot and Margin volumes are stacked up, as in traditional volume bar style.This can be disabled in Options - in which case Margin volumes are presented below zero line (this can facilitate some readings; see notes).
Standard volume for current chart's pair is presented in light gray, in the background. It helps seeing realtime volume and any surplus volume in relation to Bitfinex's.
Colors:
By default, Spot volume bars are colored in blue, but you can choose to use price closes to define them instead - as in traditional volume indicators.
You can also choose to invert Spot and Margin colors, so that Spot volumes are presented in higher contrast.
Margin volumes are, by default, colored based on whether Longs or Shorts were more relevant.
Direction attribution:
Default ratio threshold to define above-mentioned relevance is 1.1 (10%). (eg.: if Longs were greater than Shorts, Longs' volume must be at least 10% grater than Shorts' for direction of movement to be attributed to Longs). Direction then is defined based on winning side, plus whether openings or closings were dominant.
Threshold be configured from 1.01 to N. If ratio is below threshold, direction is considered neutral (yellow/orange colors).
Based on this assessment, label signals are presented at top area of chart, indicating whether opening(+) or closing(-) Longs or Shorts were the major responsibles for the move.
By default, to avoid much cluttering, labels are presented only for greater-than-average (ema 17) margin volumes. This can also be customized in Options.
Claim transactions:
Claim transactions are margin positions closed with traders' own existing assets being handed in to lenders. Thus, they do not impact order books -- and volume -- when executed.
Still, they are an additional, potentially valuable source of information, and the indicator is able to detect and report them.
Green triangle-like area shapes represent Longs closed with Claim transaction(s). Likewise, similar red shapes represent Shorts closed with Claim transactions.
This topic is explained in greater detail in this Bitfinex article .
Notes:
When using stacked up visualization, values in data window do not correspond to actual margin volumes. To see actual values, change to non-stacked up mode, and ignore negative sign.
The lower the time frame, the more precise it gets.
To request access, please send me a direct message.
For questions and feedbacks, please share them in comments section below.
Thank you, and best of success on your trades.

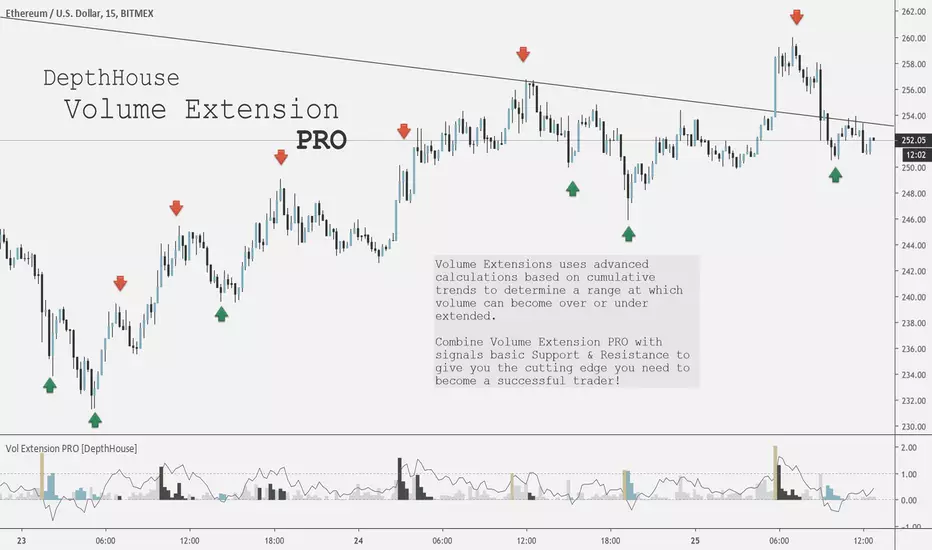
Volume Extension PRO [DepthHouse]Would you like to have an edge over other traders? By being ahead of the competition you can take faster and better decisions. We can provide you with indicators that give you full overview over the most important values that affect the movements of your assets. Get a subscription today! It's never too late to become a pro trader!
Volume Extensions PRO uses advanced calculations based on cumulative trends to determine a range at which volume can become over or under extended.
Thus signalling potential points of support or resistance.
Combine Volume Extension PRO with signals basic Support & Resistance to give you the cutting edge you need to become a successful trader!
TUTORIAL
Volume Extension:
The volume bars represent the current candle volume extension based on historical data. The higher the extension, the more volume present compared to the user set lookback period.
Volume bars that extend past 1 represent a massive surge in volume.
Extension Oscillator:
The extension oscillator is the most advance feature with this indicator. It uses cumulative volume averages to create a range in which volume travels in. The extension oscillator reads very similar to an RSI.
Over 1 = overbought / over extended volume
Under 0 = oversold / under extended volume
The extension oscillator may also be used a tool to pin point levels of volume divergence
Signal Colors:
The colored bars represent either a surge in volume (gold), or over or under extension.
These colored bars may be used to pinpoint key volume levels to help determine short or long term trend reversal points.
Combine these signals with basic support and resistance to give you professional edge!
The chart above has manual placed arrows to represent when and where the Volume Extension PRO indicator gave these signals.
Settings:
Length: Lookback period of the oscillator
Weight: Adds additional weight to the cumulative volume averages for lower volume exchanges.
Warning : This is a based volume indicator. Therefore its results are entire based on the the volume of that exchange! Some exchanges or currency pairs may not provide enough volume to give accurate results. Do not solely rely on this indicator to make your trades. Please use responsibly.
Request a FREE Trail via my website!
Volume+ by BDthis is a simple volume indicator,
shows volume sizes with color differences on histogram (total volume, neutral volume and effective volume)
bar length = total volume, gray bar= neutral volume, green bar= pozitive volume, red bar= negative volume
variable value; The bar's average will be calculated until the given value. by default is average not calculated
Volume Spike Analysis [marketsurvivalist]This indicator is based on the ideas about Volume Spike Analysis written about by Vincent Kott in his book Volume Spike Analysis. Formulas are presented in the book for another platform, but I wrote the script based on the charts he provided.
The indicator basically takes out the noise and colors bars based on factors of time and volume for day. There are three different time periods you can set: Short, Medium, Long. Each period can be set with a different color. The period value looks for highest volume bar within that period. If today's volume bar is the hightest value, it colors the volume bar based on the formatted color. It does not matter if the price bar is up or down. The defaults are 4 days, 20 days, 100 days. There is also a volume moving average available to show or hide based on you trading style.
The purpose is to easily see changes in volume. Typically, you would like to see volume rising as a new trend begins. This will show up quickly as you will see a cluster of rising red and / or purple bars.
Volume with High-Volume Highlight + ThresholdThis indicator highlights true high-volume candles without guessing.
It compares the current bar’s volume to the average volume over the last X candles and highlights bars that exceed your chosen threshold (ex: 1.5× the average).
Features
Automatic high-volume detection
Customizable volume multiplier
Bull/bear color coding
Average volume line
Threshold line (shows exactly where “high volume” begins)
Optional on-chart label showing the required volume level
Alert for any high-volume bar
What It’s Used For
Identifying breakout strength
Confirming bounce setups at key levels
Spotting real buyers/sellers stepping in
Avoiding fake moves with weak volume
Simple Rule
If volume is greater than (Average × Multiplier) → the bar is highlighted.
